Pyrolysis converts waste (tyres, mixed plastics, biomass) into several saleable streams:
Pyrolysis oil (TPO / plastic oil) — the liquid fuel that can be sold as industrial fuel, co-processed in refineries, or upgraded/distilled into diesel/naphtha. Prices move with crude and local demand for alternative fuels. Recent indices show regional pyrolysis-oil spot prices in the mid-hundreds of USD per metric ton (typical reported values ~US$500–700/MT in early-2025 for many markets).
Recovered carbon black (rCB / PCB) — a higher-value solid product that can be sold (as fuel-grade rCB) or upgraded to specialty grades for inks, rubber and plastics. Market demand and premium depend on quality and post-processing. Global carbon-black market growth supports steady demand and price pressure for recovered sources.
Recycled steel (from tyres) or char (from plastics/biomass) — lower-margin but reliable. Steel from tyres is usually sold to scrap yards.
Energy savings / self-consumption — pyrolysis tail gas and combustible fractions often power the reactor, lowering fuel costs.
Tipping fees / feedstock credits — in some regions you pay little (or receive fees) to take waste, improving margins.
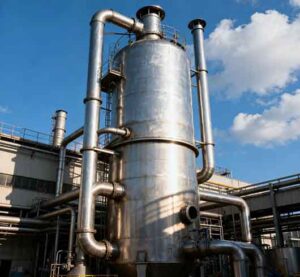
Byproduct markets — if you add refining (distillation/desulfurization) you can upgrade oil to higher-value diesel/naphtha; distillation equipment adds CAPEX but can materially increase product price. Typical distillation units are a non-trivial additional investment.
A realistic investor models all streams, their local prices, and the volume/quality the plant will actually deliver (yields vary by feedstock and process). Typical tyre yields cited in industry studies are roughly ~40–45% oil, ~30–35% carbon black, ~10–15% steel and ~5–10% gas, but yields can vary by feedstock and reactor design.
Investors find worked numbers helpful. Below is a conservative, transparent illustration using common industry yields and conservative local prices drawn from market sources and operator case studies. This is an example only — run your own sensitivity analysis.
Assumptions (inputs):
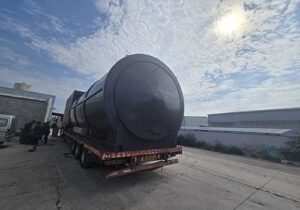
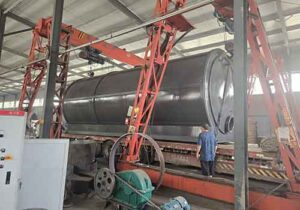
Feedstock: 10 t/day waste tyres (300 days/year → 3,000 t/yr)
Typical tyre pyrolysis yields (industry ranges): 45% oil, 35% rCB, 15% steel.
Market prices (conservative mid-range used for calculation):
Pyrolysis oil: US$600 / MT (regional indices and industry reports place oil broadly in the US$500–700/MT band in 2024–2025; prices depend on market and whether you distill it further).
Recovered carbon black: US$1,000 / MT (industry whitepapers show rCB in high hundreds to low thousands depending on quality; supplier analyses commonly cite $900–1,200/MT as realistic ranges).
Recycled steel: US$350 / MT (conservative scrap steel estimate).
Annual operating days: 300 (allowing downtime/maintenance).
CAPEX (equipment, basic installation, local works): assume a modest US$250,000 for a batch/semi-continuous 10 tpd tyre system (illustrative — quotes vary widely).
Monthly OPEX (labour, utilities, maintenance, consumables): US$12,000/month → US$144,000/yr (industry supplier figures are in this range).
Yields and volumes (annual):
Oil: 10 t/day × 45% × 300 days = 1,350 t/yr
rCB: 10 × 35% × 300 = 1,050 t/yr
Steel: 10 × 15% × 300 = 450 t/yr
Top-line revenue (annual):
Oil: 1,350 t × $600 = $810,000
rCB: 1,050 t × $1,000 = $1,050,000
Steel: 450 t × $350 = $157,500
Total revenue ≈ $2,017,500 / year
Costs (annual):
OPEX: $144,000
Feedstock: many tyre projects receive tyres at low cost or with tipping fees; if you must buy feedstock this number must be added. For this example assume neutral feedstock cost (you either obtain tyres for little/no cost or with small handling fees). If you must purchase feedstock, subtract that cost here.
Selling/distribution costs, taxes, maintenance reserves, insurance, and administrative costs: add conservatively $150,000 (estimate — depends on local business costs).
EBITDA-style profit (approximate):
Revenue: $2,017,500
Less operating + overhead (~$294,000) = $1,723,500 gross margin before depreciation, interest, tax
Even after conservative allowances, the illustration shows a healthy gross margin, which explains why many small projects report rapid payback. That said, this is illustrative — you must adapt assumptions for local prices, feedstock costs and product quality. The revenue numbers above rely on mid-range product prices; lower local prices or higher OPEX materially change the result. Use a sensitivity table (price ±20%, OPEX ±25%) to see the range of outcomes. The revenue ranges cited in supplier and market reports align with this ballpark analysis.
Feedstock risk: declining supply, unexpected purchase costs, or competition. Mitigation: multiyear collection contracts, feedstock diversification (tyres + mixed plastics), or vertical integration with waste collectors.
Product market risk: local buyers may pay far less than index prices; oil pricing ties to crude/diesel spreads. Mitigation: secure offtake agreements, diversify buyers (industrial fuel, cement, co-processing), or add distillation to reach higher grades.
Regulatory & permitting risk: air emissions, hazardous waste classification, licensing delays. Mitigation: budget time and CAPEX for emissions systems, hire local consultants early.
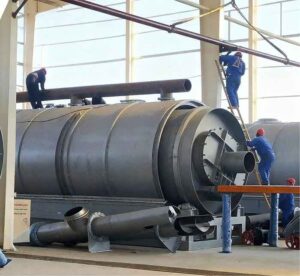
Technological & operational risk: poor yields, downtime, high maintenance costs. Mitigation: choose proven reactor designs, plan preventive maintenance, train operators, and run pilot trials.
Economic cycles & commodity risk: oil price drops or carbon black oversupply compress margins. Mitigation: perform scenario analysis, maintain working capital, negotiate flexible contracts.
Reputation & ESG risk: NGOs or local communities may oppose projects perceived as polluting. Mitigation: transparency, best available emissions controls, community engagement, and third-party monitoring.
A balanced risk mitigation plan is essential before you sign major purchase orders or accept investor funds.
If you’re evaluating a pyrolysis project, follow a short checklist. Pyrolysis Unit can support or deliver these steps if you want help.
Immediate feasibility checklist (do this before you buy equipment):
Quantify feedstock — confirmed volumes, seasonal variation, price or tipping fee.
Obtain local product price quotes — industrial fuel buyers, carbon black recyclers, steel scrap buyers; get written LOIs if possible. (Market indices are useful but local offtake terms drive economics.)
Request detailed, itemized CAPEX and OPEX from suppliers (equipment, pre/post treatment, control systems). Don’t accept a single “plant price” without line items for emission controls and spares.
Build a 3-case financial model (base / optimistic / conservative) with sensitivity on oil price, rCB price, feedstock cost, and downtime.
Factor permitting timelines & community engagement into your schedule and cashflow — delays cost real money.
Pilot or contractor-supervised commissioning — plan for 6–12 months to reach steady yields and qualified buyers.
What to ask equipment suppliers (short list):
Guaranteed continuous throughput and typical steady-state oil/rCB/steel yields under local feedstock. (Ask for independent test reports.)
Emission control specs and third-party emissions testing results.
Spare parts list, lead times and annual maintenance percent.
References to plants in similar climates/markets and independent performance data.
Options for downstream upgrades (distillation, desulfurization) and their incremental CAPEX/OPEX.