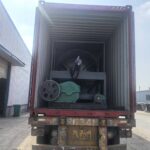
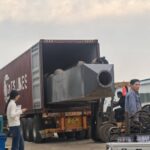
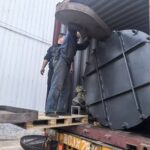
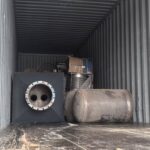
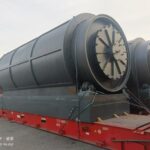
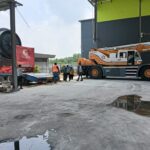
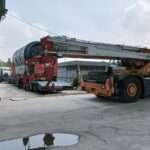
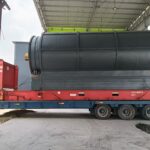
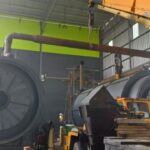
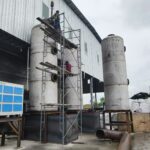
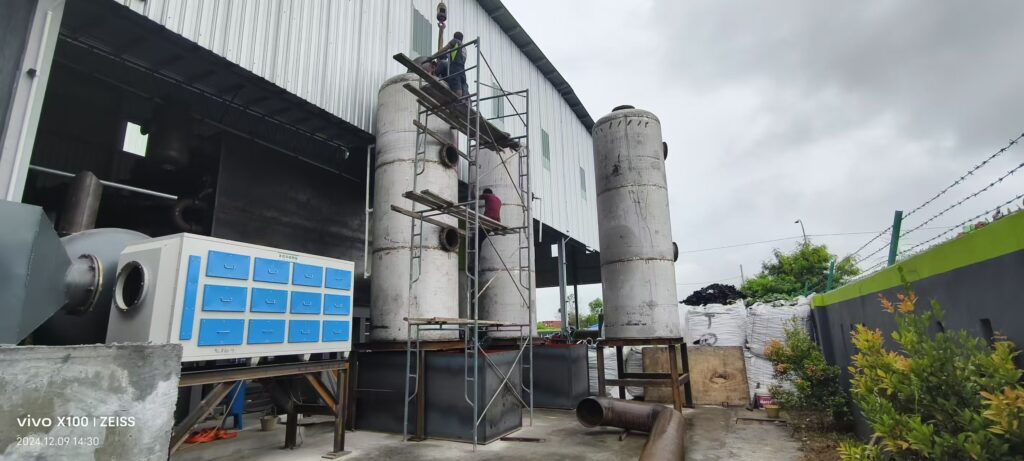
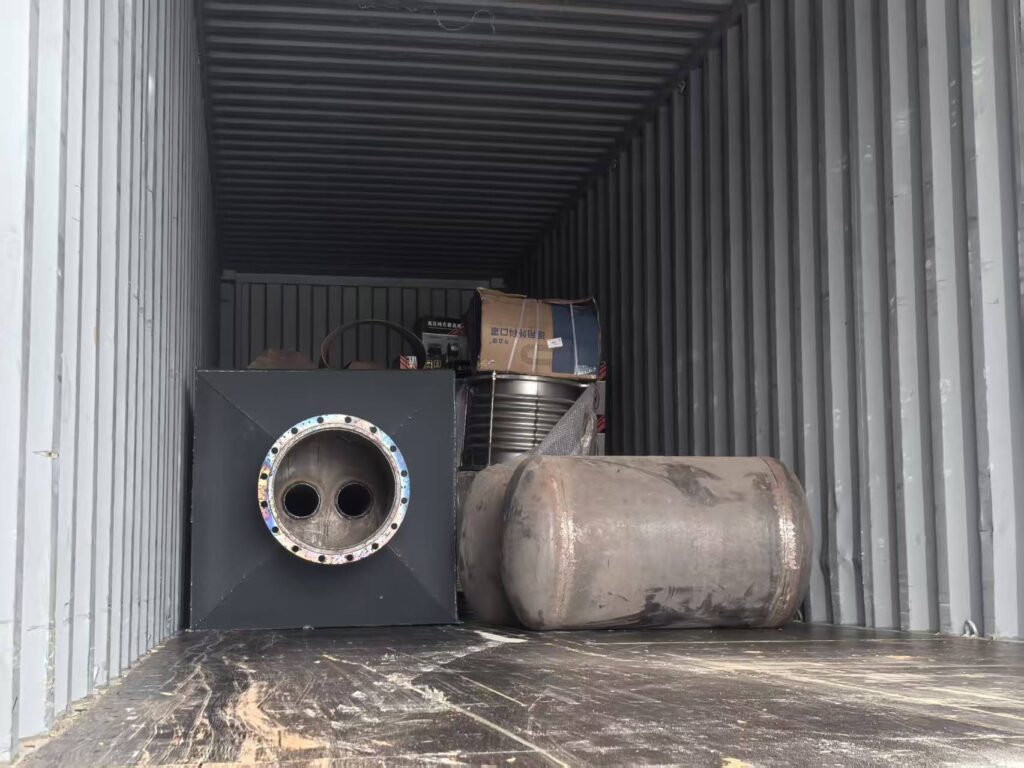
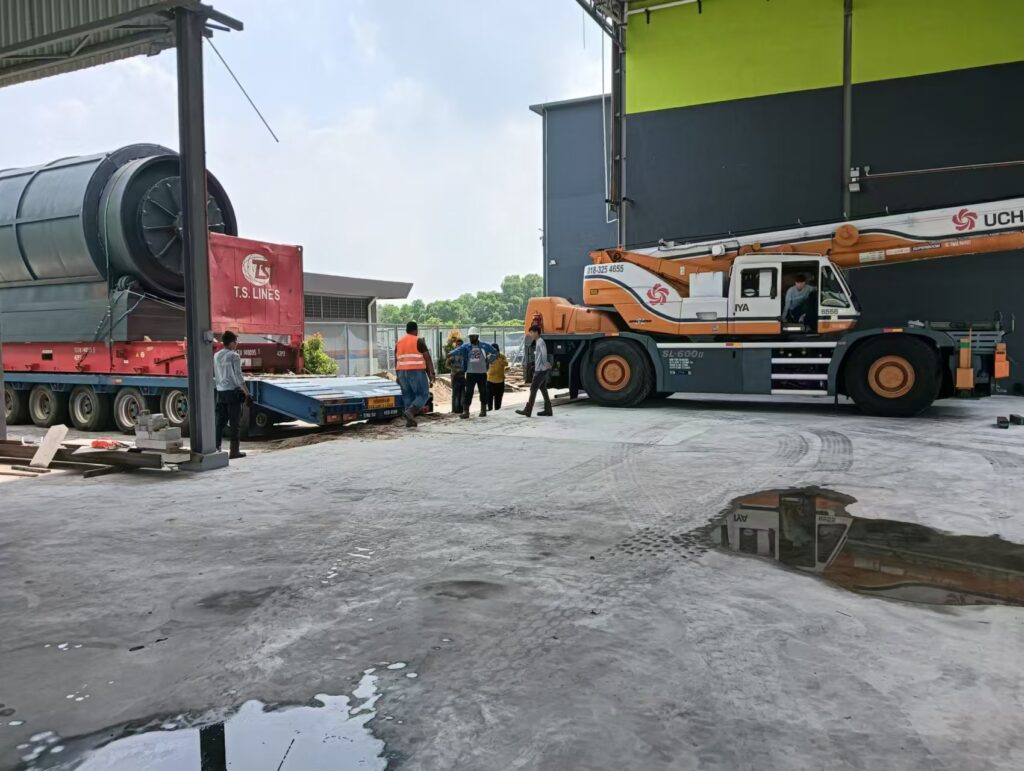
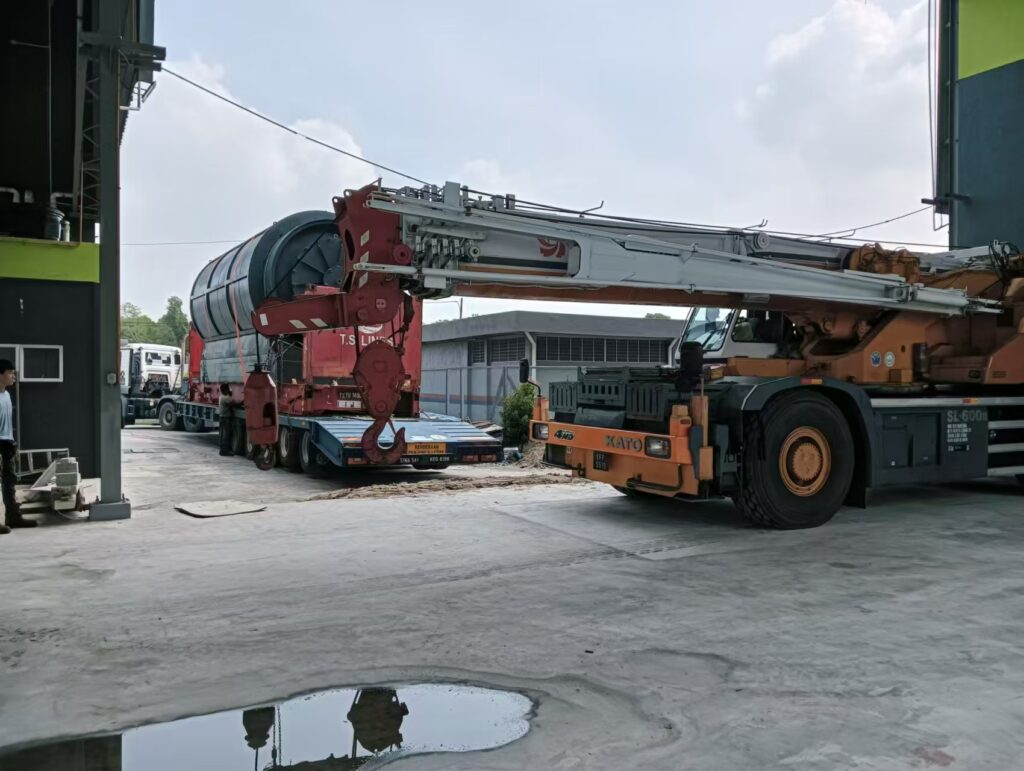
Distillation Equipment Project in Malaysia In February 2026, a waste-tire
Two Waste Plastic Pyrolysis Units
In September 2024, A Malaysian Company Purchased Two Waste Plastic Pyrolysis Units
Project background
In September 2024 a Malaysian private company purchased two industrial pyrolysis units intended primarily for waste plastic processing. The client also wanted the flexibility to accept end-of-life tyres (ELTs) to broaden feedstock supply and improve commercial returns. The objective was to convert disposed tyres/plastics into marketable pyrolysis oil, recover carbon black and scrap steel, and to build a financially sustainable recycling operation that reduces landfill and supports local circular-economy goals.


Professional Solution Developed For The Client
We designed a turnkey solution that combined proven process equipment, emission controls, product conditioning, and operator training so the client could run a compliant, reliable facility with both plastic and tyre feedstocks.
Key elements of the solution:
Feedstock preparation: installation of shredders and magnetic separators to remove large metal and classify feedstock. For ELTs we recommended a two-stage shredder (primary cutter + granulator) to produce uniform 10–30 mm feedstock for stable pyrolysis.
Process selection: continuous screw/reactor pyrolysis lines sized to match the client’s throughput goals, selected for stable thermal control, high availability and ease of maintenance. Reactor design included reliable heating (fired or electric), robust seals, and provisions for inerting and safe start/stop.
Product recovery & conditioning: multi-stage condensation train to maximize liquid yield and reduce carryover, an oil polishing skid (coalescer + filter) to meet end-customer specs, and a cyclone + baghouse for particulates.
By-product handling: automatic steel separation and a carbon black collection & drying system. We proposed an optional mild upgrading step for carbon black (grit removal, magnetic separation, sizing) to increase market value.
Energy integration & safety: non-condensable pyrolysis gas was routed to a thermal oxidizer and a gas-fired heater to minimize external fuel needs. Emissions control (afterburner + scrubber + continuous monitoring) was integrated to meet local regulation.
Automation & training: PLC with HMI, remote diagnostics capability and a 5-day on-site training program for operators, plus a 12-month spare parts kit and performance warranty.
Commercial & logistics support: assistance with local permits, product offtake introductions (fuel blenders, industrial furnace users and scrap brokers), and an operations manual with QA/QC procedures.
This package balanced capital expenditure, operational simplicity and product quality so the client could start with tyres/plastics mix and scale sales channels for oil, carbon black and steel.
Project Results

ISO CE Approved
The equipment quality has passed IAF, CNAS, ISO, CE certifications, Certified by international professional organizations, the equipment is safe and reliable.

AAA Credit Audited Enterprise
One of the top refining equipment manufacturers in China, The government Audited Superb as AAA credit company (top level).

Solutions for Pyrolysis And Distillation
We will provide you with the latest industry solutions, and provide you with a one-year after-sales warranty to ensure stable operation of the equipment.

24-hour service
We have professional engineers to solve various problems for you, including equipment, process, material problems, etc.

Professional R&D team
We have obtained a number of utility model patents, including distillation production equipment and pyrolysis module equipment.
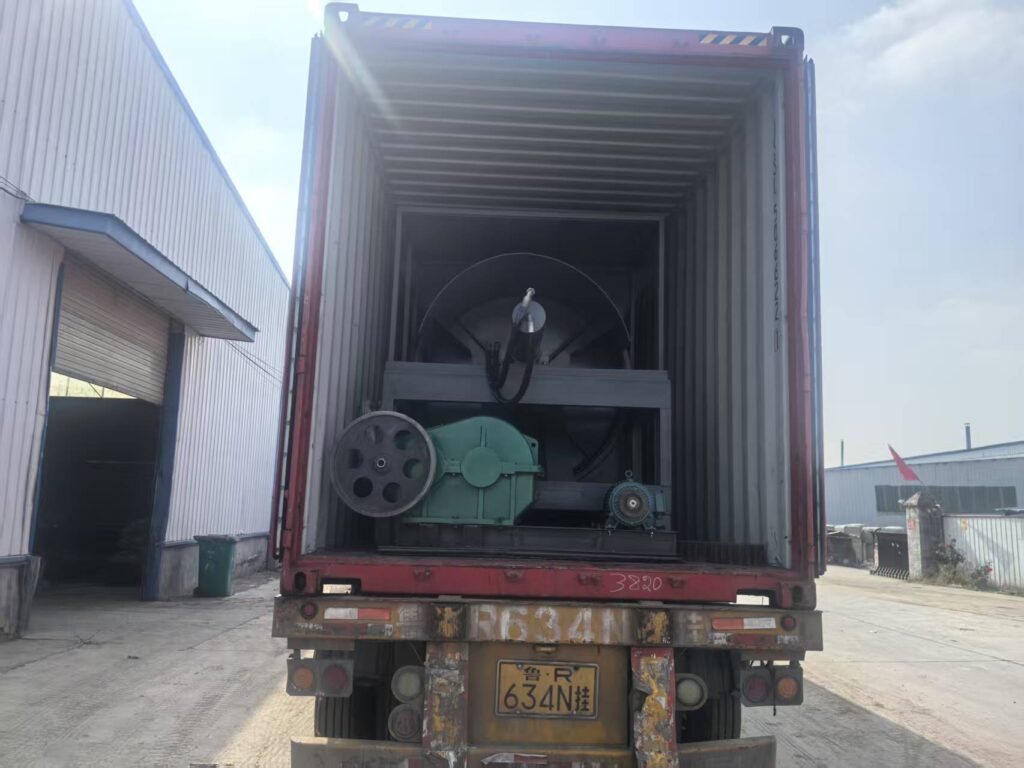
Fast Delivery
We have sufficient stock of pyrolysis and distillation equipment to ensure efficient logistics and fast delivery.
Assumptions used for the calculations
Two identical pyrolysis units.
Processing rate per unit: 20 tonnes per day (t/day).
Operating days per year: 330 days (allowing maintenance/downtime).
Annual processed feedstock = 20 t/day × 330 days × 2 units = 13,200 tonnes/year.
Feedstock is ELT (tyres) or mixed tyre/plastic blend. Typical yield assumptions for tyre pyrolysis:
Pyrolysis oil yield = 45% by weight.
Carbon black (solid) = 30% by weight.
Steel (wire) = 10% by weight.
Non-condensable gas and losses = the remainder (~15%), used onsite for energy.
Product sale prices (conservative estimates for calculation):
Pyrolysis oil: USD 400 per tonne.
Recovered carbon black: USD 150 per tonne.
Scrap steel: USD 150 per tonne.
Capital expenditure (CAPEX):
Cost per unit (installed, inclusive of basic utilities & shipping): USD 800,000
Other site CAPEX (civil works, pre-treatment, installation, emissions package, commissioning): USD 400,000
Total CAPEX = (2 × 800,000) + 400,000 = USD 2,000,000
Operating expenditure (OPEX): USD 150 per tonne processed (covers labor, utilities, maintenance, consumables, transport and general overhead).
Performance calculations (step-by-step)
Annual processed feedstock
Per unit annual = 20 t/day × 330 days = 6,600 t
Two units = 6,600 t × 2 = 13,200 t/year
Annual product quantities
Oil: 13,200 t × 45% = 13,200 × 0.45 = 5,940 tonnes oil/year
Carbon black: 13,200 × 0.30 = 3,960 tonnes/year
Steel: 13,200 × 0.10 = 1,320 tonnes/year
Oil volume (for fuel customers)
Assume pyrolysis oil density ≈ 0.85 kg/L.
1 tonne = 1,000 kg → volume per tonne = 1,000 / 0.85 ≈ 1,176.47 L/tonne
Annual oil volume = 5,940 t × 1,176.47 L/t ≈ 6,988,235 liters/year (~43,951 oil barrels, using 159 L/barrel).
Annual revenue (product sales)
Oil revenue = 5,940 t × USD 400/t = USD 2,376,000
Carbon black revenue = 3,960 t × USD 150/t = USD 594,000
Steel revenue = 1,320 t × USD 150/t = USD 198,000
Total annual revenue = 2,376,000 + 594,000 + 198,000 = USD 3,168,000
Annual operating costs
OPEX = 13,200 t × USD 150/t = USD 1,980,000
Annual profit before tax (simple)
Profit = Total revenue − OPEX = 3,168,000 − 1,980,000 = USD 1,188,000
Return on investment / payback
Total investment (CAPEX) = USD 2,000,000
Payback period (years) = CAPEX / annual profit = 2,000,000 / 1,188,000 ≈ 1.68 years (~20 months)
Equivalent annual ROI = annual profit / CAPEX = 1,188,000 / 2,000,000 = 59.4% per year
Sensitivity notes (brief)
If pyrolysis oil price falls by 20% (to USD 320/t), total revenue and profit fall substantially and payback extends. Conversely, a higher oil price or better carbon black upgrades shortens payback.
Feedstock acquisition cost (if the operator must pay for tyres) or lower operating days materially affect economics.
Sale contract quality (e.g., offtake at a premium for polished oil) can improve margins.
Waste Plastic-to-Fuel Refining Equipment Two Sets of Waste Plastic-to-Fuel Refining
Summary & conclusion
The two-unit pyrolysis installation purchased in September 2024 was sized to provide a robust, commercially viable conversion pathway for tyres and mixed plastics. With conservative operating assumptions (20 t/day per unit; 330 days/year) the plant can process 13,200 t/year, producing ~5,940 t/year of pyrolysis oil (~7.0 million liters), 3,960 t/year of carbon black, and 1,320 t/year of steel. Using conservative product prices and realistic OPEX, the simple model shows annual gross revenue ≈ USD 3.17M, annual profit ≈ USD 1.19M, and a project payback around 1.7 years — demonstrating the strong commercial potential of well-executed pyrolysis projects when feedstock access, product quality and offtake are managed.
Practical next steps we recommended to the client
Secure medium-term offtake contracts for oil (industrial fuel/blending) and for upgraded carbon black to lock prices.
Optimize feedstock logistics to keep costs low (tipping fees can enhance margins).
Implement routine product QA and minor upgrading of carbon black to increase sale value.
Monitor local fuel regulations (blending limits, certification) and emissions to maintain compliance and market access.
If you want, I can now:
produce a one-page brochure version of this case study for investors, or
run alternative scenarios (e.g., different oil prices, different operating days, or different CAPEX/OPEX) and show a 3-way sensitivity table so you can see break-even and best/worst cases. Which would you prefer?